Chuseok Landed in September, Yet Retail Sales Growth Slowed to 4.5% — Below August's 7.7%
2026-11-03 8:40 AMGeneral
Overview
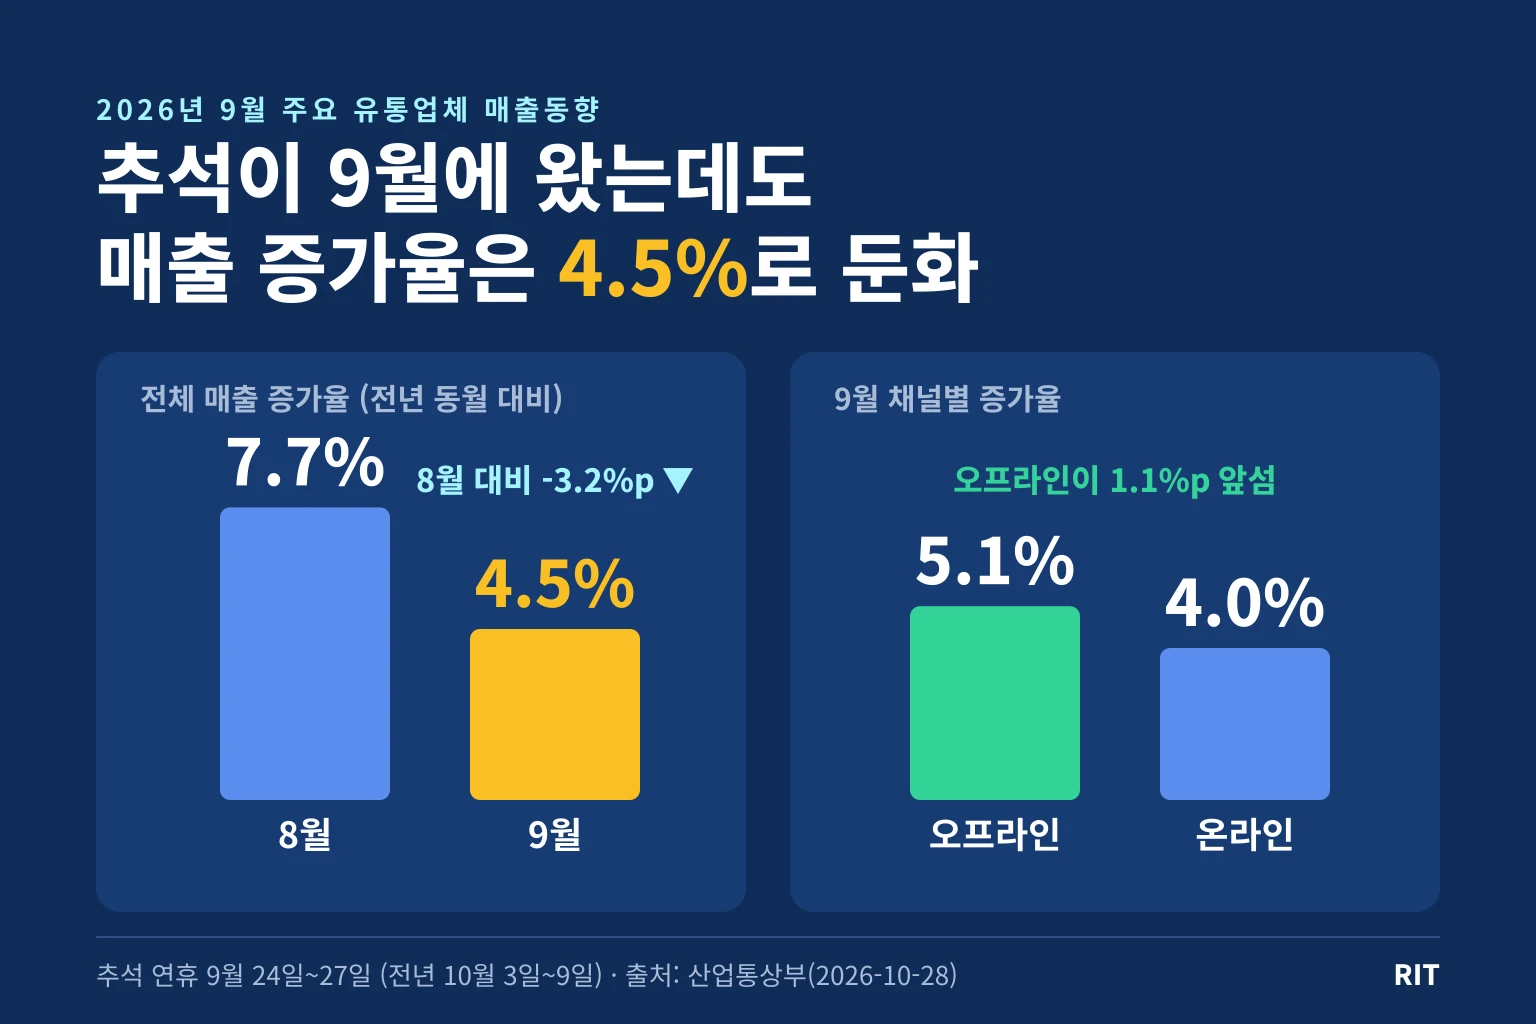
Major retailer sales for September, released October 28 by Korea's Ministry of Trade, Industry and Resource, rose 4.5% year-over-year to an estimated KRW 17.1 trillion. Even with the Chuseok holiday pulled forward to September 24–27, growth was below August's 7.7%; online fell from 9.3% to 4.0%, and offline (5.1%) outpaced online. But online faced a high base from September last year, and August and September combined come to roughly 6%.
September 2026 major retailer sales growth — slower than August even with Chuseok in September (Source: our own chart based on MOTIR data released 2026-10-28)
Sales at major retailers in September 2026, released by Korea's Ministry of Trade, Industry and Resource (MOTIR) on October 28, rose 4.5% from a year earlier. Offline grew 5.1% and online 4.0%, so offline growth outpaced online. The survey covers 26 companies: 15 offline and 11 online.
This year's Chuseok holiday ran from September 24 to 27, earlier than last year's October 3 to 9. MOTIR cited higher sales of gift sets and ancestral-rite food items as a driver of September's increase. Even so, the growth rate was 3.2 percentage points lower than August's 7.7%.
Our August analysis noted that September growth could be lifted by Chuseok's main demand. The actual result went the other way. Here we look at where the momentum faded, and how much of that slowdown is real.
July–September: Online Pulled the Growth Rate Down
Category
July
August
September
Change vs. August
Total
+6.4%
+7.7%
+4.5%
-3.2pp
Offline
+3.2%
+5.4%
+5.1%
-0.3pp
Online
+8.5%
+9.3%
+4.0%
-5.3pp
Hypermarkets
-11.2%
+4.5%
+4.0%
-0.5pp
Department stores
+17.9%
+11.9%
+8.4%
-3.5pp
Convenience stores
+1.1%
+0.8%
+2.9%
+2.1pp
SSM
-2.9%
+5.0%
+5.0%
0.0pp
The biggest reason the overall growth rate fell is online. Online slowed by 5.3 percentage points, and at 59.5% of sales it is the largest segment, so its pull on the total was large. Offline held close to August's level, and among formats only convenience stores saw their growth rate rise.
Offline growing faster than online has happened three times in the 2026 monthly figures: February (15.2% vs. 3.9%), May (9.3% vs. 8.8%), and now September.
September Sales Estimated at About KRW 17.1 Trillion, With Just Over Half of the Increase From Online
MOTIR again published only growth rates and each format's share, not absolute sales amounts. Applying this year's 4.5% growth rate to the KRW 16.4 trillion reported as total sales for September 2025 (23-company basis) gives an estimate of about KRW 17.14 trillion for September 2026. This is a conversion estimate, not a figure published by MOTIR.
Estimated September 2026 sales
 = September 2025 sales of about KRW 16.4 trillion × 1.045
 = about KRW 17.14 trillion
Format
YoY change
Share of sales
September 2025 back-calculated estimate
September 2026 estimate
Estimated change
Hypermarkets
+4.0%
9.1%
About KRW 1.50 trillion
About KRW 1.56 trillion
About +KRW 60 billion
Department stores
+8.4%
14.4%
About KRW 2.28 trillion
About KRW 2.47 trillion
About +KRW 191 billion
Convenience stores
+2.9%
14.9%
About KRW 2.48 trillion
About KRW 2.55 trillion
About +KRW 72 billion
SSM
+5.0%
2.1%
About KRW 340 billion
About KRW 360 billion
About +KRW 17 billion
Online
+4.0%
59.5%
About KRW 9.80 trillion
About KRW 10.20 trillion
About +KRW 392 billion
Note: The sales amounts are not figures officially published by MOTIR. They are conversion estimates that apply the September 2026 growth rates and shares by format to the publicly reported total sales of about KRW 16.4 trillion for September 2025. Rounding of the base figure and shares, and changes in the survey population, can cause differences from actual sales.
Adding up the increases by format gives about KRW 730 billion, of which online accounts for about KRW 390 billion, or roughly 53%. In August, online made up about KRW 860 billion (71%) of a roughly KRW 1.21 trillion increase. Online's contribution shrank, and the share taken by offline formats such as department stores (about +KRW 191 billion) and convenience stores (about +KRW 72 billion) grew by that much.
This conversion carries the same limitation as August's. The base total of KRW 16.4 trillion comes from the 2025 release, in which online was 53.8% of sales, while this release puts online at 59.5%. Splitting the base by the 2025 shares puts September 2025 online at about KRW 8.82 trillion, versus about KRW 9.80 trillion back-calculated in the table above — a gap of about KRW 1.0 trillion (our own calculation). Because the survey population or basis of compilation may have changed, the online/offline split in these amounts should be used only to read direction. Conversion tables by format and product category are compiled alongside the August figures on the Major Retailer Sales Trends data page.
Online Slows From 9.3% to 4.0% — Read It Against Last September's Base
It is too early to read online's 5.3-point slowdown as weaker consumption, because online growth in September last year was unusually high. The September 2025 online growth rate recorded in e-National Indicators is 17.6%, nearly double August's 9.2%. Coverage at the time of the October 2025 release put it at 16.5%, slightly different, but the direction is the same.
Linking last year's and this year's growth rates into a two-year figure changes the picture.
Category
September 2025
September 2026
Two-year linked
Total
+9.1%
+4.5%
+14.0%
Offline
-1.4%
+5.1%
+3.6%
Online
+17.6%
+4.0%
+22.3%
Hypermarkets
-11.6%
+4.0%
-8.1%
Department stores
+4.8%
+8.4%
+13.6%
Convenience stores
+0.6%
+2.9%
+3.5%
SSM
-0.2%
+5.0%
+4.8%
Note: Reference values that mathematically chain each year's YoY growth rate; they are not a chain of the same companies' actual sales. The September 2025 figures are the e-National Indicators entries and differ from coverage at the time of the October 2025 release (total 7.7%, offline -1.0%, online 16.5%, hypermarkets -11.7%, convenience stores 0.9%). Chaining the figures from that time gives 12.5% for the total and 21.2% for online.
Online's two-year linked figure actually rose from 19.4% in August to 22.3% in September. Even using the figures from the time of release, it is similar to August's, at 20.8% versus 21.2%. The 4.0% on its own makes online look like it faltered, but stripping out the base, there is room to read it as growth continuing at August's pace. When the September 2025 results were released, Herald Business ran the headline "Is It the Consumption Coupon Effect?", but we could not confirm in this piece what drove the high base.
By product category, online food rose 6.7% and services/other 10.6% (including food delivery, travel and culture products, and e-coupons), cosmetics 7.2%, and kids/infant 5.8%. Appliances/electronics (-0.1%), sports (-2.2%) and fashion apparel (-5.1%) declined. That contrasts with offline fashion/accessories, which rose 7.3%, but online is split as fashion apparel and offline as fashion/accessories, so a simple comparison is difficult.
As far as we could check, neither the MOTIR release nor press coverage explained why online growth slowed. The base effect is the most visible explanation, but a consumption slowdown or a change in the survey population may be mixed in.
Department Stores Slow for a Third Straight Month; Hypermarkets Keep Growing From a Low Base
Department stores grew 8.4%. After 22.2% in June, 17.9% in July and 11.9% in August, the growth rate fell again in September — even though food rose 13.0% on holiday gift sets, and women's casual wear (15.2%) and men's apparel (8.7%) grew on autumn-season demand. If food grew 13.0% while the total grew 8.4%, the arithmetic says the rest of the store grew by less than 8.4%. The overseas luxury brands category's growth rate also fell from 15.6% in August to 6.9% in September.
Hypermarkets grew 4.0%, a second straight month of growth. Food rose 4.3%, appliances/toys 5.8% and apparel 11.2%, and the purchase count, which had been falling for six months, edged up 0.5%. According to press reports, spend per customer also rose 3.5%.
Still, it is too early to read a return to growth as a recovery. Hypermarkets in September 2025 fell 11.6%, a low baseline. MOTIR attributed that decline at the time to Chuseok moving from September to October. The two-year linked figure is -8.1%, meaning this September's hypermarket sales are about 8% below September 2024. Chuseok in 2024 also fell in mid-September (the 16th to the 18th), so this comparison chains two years in which the holiday was in September, which makes the effect of the holiday shift relatively small. It is better than August's linked figure (-11.3%) but still short of 2024 levels.
Convenience stores grew 2.9%, better than August's 0.8%. MOTIR pointed to processed food rising 5.9% as one-person households looked for ready meals over the holiday. SSM grew 5.0% as agricultural, livestock and fisheries products rose 10.0% on demand for ancestral-rite items.
By Product Category, Food Accounts for 56% of the Increase
Category
YoY change
Share of sales
September 2026 estimate
Estimated change
Food
+6.3%
40.5%
About KRW 6.94 trillion
About +KRW 411 billion
Services/other
+7.3%
14.1%
About KRW 2.42 trillion
About +KRW 164 billion
Fashion/accessories
+3.1%
10.7%
About KRW 1.83 trillion
About +KRW 55 billion
Overseas luxury brands
+6.9%
4.7%
About KRW 810 billion
About +KRW 52 billion
Kids/sports
+3.2%
5.2%
About KRW 890 billion
About +KRW 28 billion
Home/household
+0.8%
13.3%
About KRW 2.28 trillion
About +KRW 18 billion
Appliances/culture
+0.3%
11.5%
About KRW 1.97 trillion
About +KRW 6 billion
Note: The product category amounts apply the published category shares to the estimated total of about KRW 17.14 trillion and may differ from the sum of individual companies' actual category sales. Because of rounding in the shares, the total increase by format (about KRW 730 billion) and by category (about KRW 735 billion) do not match.
Food's increase of about KRW 411 billion is roughly 56% of the total increase by category. In August, calculated the same way, food's share was about 41%. Food and services/other together account for about 78% of the increase, while appliances/culture (+0.3%) and home/household (+0.8%) barely grew. It is a pattern consistent with the effect of the Chuseok shift being concentrated in food.
August and September Combined Come to About 6% — Judgment Waits for October
Because Chuseok straddles August's gift-set pre-sales and September's main demand, it is better to read the two months together. Applying 7.7% to August 2025's total of KRW 15.7 trillion and 4.5% to September's KRW 16.4 trillion gives a combined growth rate of about 6.1% (our own calculation; a two-month base of about KRW 32.1 trillion growing to an estimated KRW 34.0 trillion). That is close to July's 6.4% and below the first half's 7.3%.
The combined rate falls short of the first half's 7.3% even though the holiday effect was split across August and September. But last September's high base may also be at work, so this number alone cannot be read as consumption slowing.
October is what remains. It will be compared against a month that included last year's seven-day Chuseok holiday, so growth at hypermarkets, department stores and SSMs could fall sharply. Only the combined August–October figure will show the trend with the holiday shift removed.
This survey is based on nominal sales at 26 major retailers, and its sample and price basis differ from Statistics Korea's retail sales index. Sales can rise from higher prices or spend per customer alone, so these figures cannot stand in for the direction of domestic consumption as a whole.
✦RIT's Insights
That growth came in below August even with Chuseok landing in September suggests the drag from last year's high base outweighed the lift from the holiday. So it is too early to say online has faltered on the 4.0% alone, and I plan to check this slowdown once more against the October figures. October will be compared against the month that held last year's Chuseok, so the numbers are likely to look weak, and only by bundling August through October will the real trend show. I will be watching two indicators: whether department store growth drops further from the 8% range, and whether hypermarkets stay positive in a month without a holiday.
Absolute amounts (KRW trillion/billion), two-year linked figures and the August–September combined growth rate are conversion estimates calculated from published growth rates and shares, not values published by an agency, and may differ because of rounding and sample changes. The September 2025 growth rates differ between the e-National Indicators entries and coverage at the time of release, and we could not check the original.
#General Retail#General#Korea#General Retail#Ministry of Trade Industry and Resource#Retail Sales Trends#Department Stores#Hypermarkets#SSM#Convenience Stores#Online Retail#Chuseok