Behind the 7.3% Rise in Retail Sales — Department Store Growth and the Homeplus Sale
2026-07-30 11:40 AMGeneral
Overview
The Ministry of Trade, Industry and Energy's first-half retail sales report, released July 29, showed overall revenue up 7.3% year-over-year. But behind that average lies extreme polarization: department stores up 20.1% against hypermarkets' ninth straight quarter of decline. Department stores rode luxury concentration and per-store productivity; online mixed an appliance surge with a fashion slump; E-Mart and Lotte Mart survived selectively; and Homeplus had to sell off its core assets.
On July 29, Korea's Ministry of Trade, Industry and Energy released its first-half 2026 sales data for 26 major retailers. The headline — "overall revenue up 7.3%" — reads like good news signaling a consumption recovery. But the same release contains numbers pointing in the opposite direction. Department stores grew 20.1% in the first half, and 22.2% in June alone, extending their run of blistering growth, while hypermarkets posted their ninth consecutive quarter of decline since Q2 2024, and supermarket chains (SSM) their fourth straight quarter of decline. And just weeks before this release, Homeplus — the third-largest hypermarket operator — sold off its core SSM asset, Homeplus Express, to Harim-affiliated NS Shopping. A single average of "+7.3%" completely obscures the fact that, within the same industry, one side is enjoying record-high growth while the other is essentially being pushed out.
The Ministry of Trade, Industry and Energy's first-half 2026 retail sales trends, released July 29 — a single line reading +7.3% hides both department stores' rapid growth and hypermarkets'/SSM's longest run of decline on record
The Numbers — What Rose and What Collapsed
The by-format figures from this release break down as follows.
Format
H1 Change (YoY)
June Change (YoY)
June Revenue Share
Overall
+7.3%
+9.5%
100%
Department Stores
+20.1%
+22.2%
15.2%
Convenience Stores
+3.7%
+5.1%
15.0%
Online
+8.1%
+11.7%
60.4%
Hypermarkets
-7.3%
-10.5%
7.5%
SSM
-6.6%
-10.8%
1.9%
Offline overall grew 6.2%, online grew 8.1%. The ministry credited the growth to "the consumer sentiment index rising from 97 last year to 107 this year" and "foreign tourist arrivals rising from 8.83 million to 10.71 million." With 69.7% of hypermarket revenue and 92.9% of SSM revenue concentrated in food, these two formats take a direct hit whenever food spending migrates to other channels — a point we return to with data later.
Inside Department Stores — What the Big Three's Results Reveal About the Real Face of This Growth
Department stores' +20.1% (first half) and +22.2% (June) didn't appear overnight. Looking at the ministry's quarterly department-store revenue growth data for the 26 companies surveyed, this growth is the peak of a trend that has steadily accelerated over the past four quarters.
Period
2023
2024
2025
2026
Q1
—
+5.5%
+1.5%
+17.4%
Q2
—
+0.8%
-0.4%
+22.9%
Q3
+1.6%
-0.7%
+4.3%
—
Q4
+0.1%
0.0%
+11.2%
—
Annual
+1.1%
+1.4%
+4.3%
—
Through 2024 and the first half of 2025, department stores were stuck in low single-to-mid-single-digit growth — even outright decline (-0.4%) in Q2 2025. Then growth accelerated for four straight quarters: Q3 2025 (+4.3%) → Q4 (+11.2%) → Q1 2026 (+17.4%) → Q2 2026 (+22.9%). June's +22.2% isn't an anomaly — it's the latest point on an acceleration curve that has run for nearly a year.
The same release's monthly product-category revenue growth data (year-over-year) also shows what drove this acceleration. As recently as June 2025, department stores' non-food subtotal was negative at -1.6% (accessories -13.3%, women's casual wear -4.7%). But starting in January 2026, the rebound widened every month, and by June, overseas luxury brands hit +34.3%, home goods +35.6%, accessories +11.9%, and even food rose +9.3%, pushing the non-food subtotal to +22.7% and the overall total to +22.2%. Home goods in particular saw its growth rate nearly sextuple in two months — from +6.0% in April to +17.3% in May to +35.6% in June — an acceleration too sharp to attribute to seasonal peak effects alone, suggesting specific promotions or events likely overlapped as well. Breaking these numbers down by company reveals the real face of this growth.
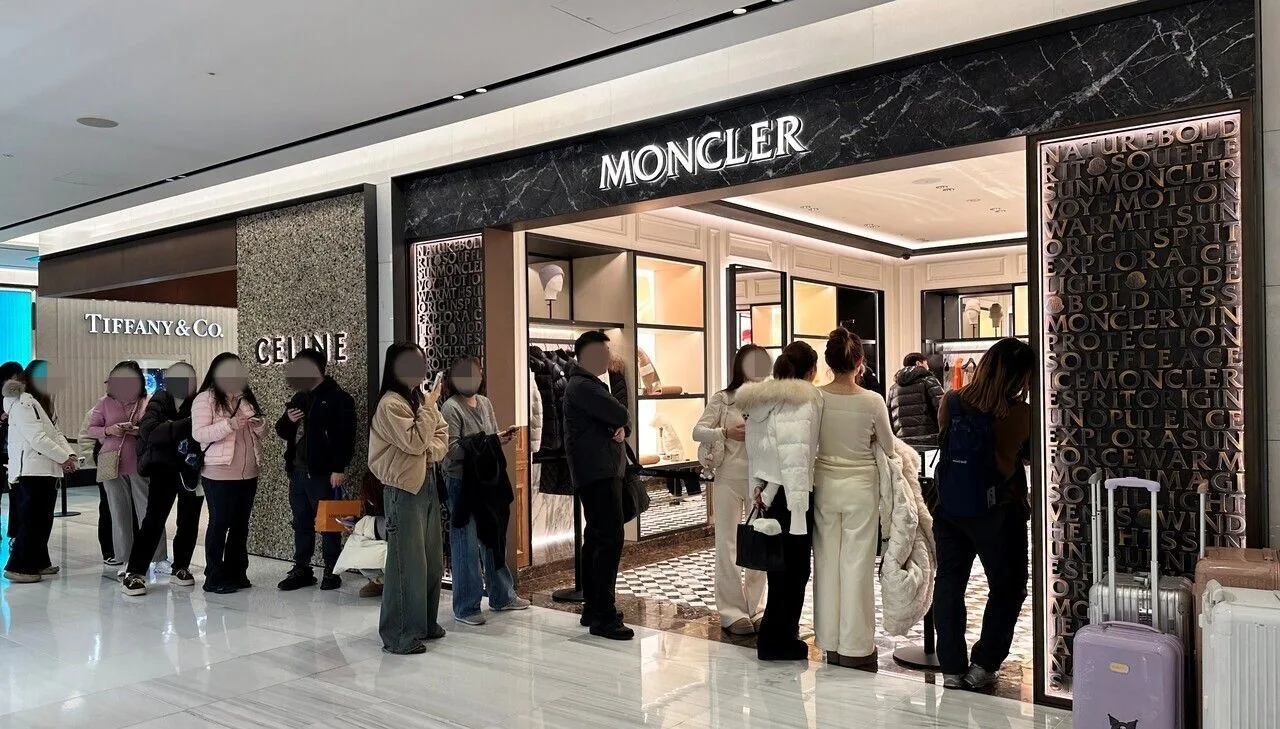
Lotte Department Store: First-half foreign revenue reached KRW 640.0 billion, up 125% year-over-year — a record for any half-year period. Overseas luxury revenue rose 130%, and fashion categories rose 135%. The Myeongdong flagship store alone grew 140% and accounted for about 30% of company-wide revenue. The foreigner-exclusive "Tourist Membership" program issued 130,000 cards in its first seven months, and a UnionPay QR/NFC quick-pass system is set to launch in September.
Shinsegae Department Store: First-half foreign revenue reached KRW 580.0 billion (+120%), filling 90% of last year's entire annual foreign revenue (KRW 650.0 billion) in just six months. Unlike Lotte, growth here was broad-based, spanning not just luxury (+129%) but fashion, cosmetics, and food & beverage as well.
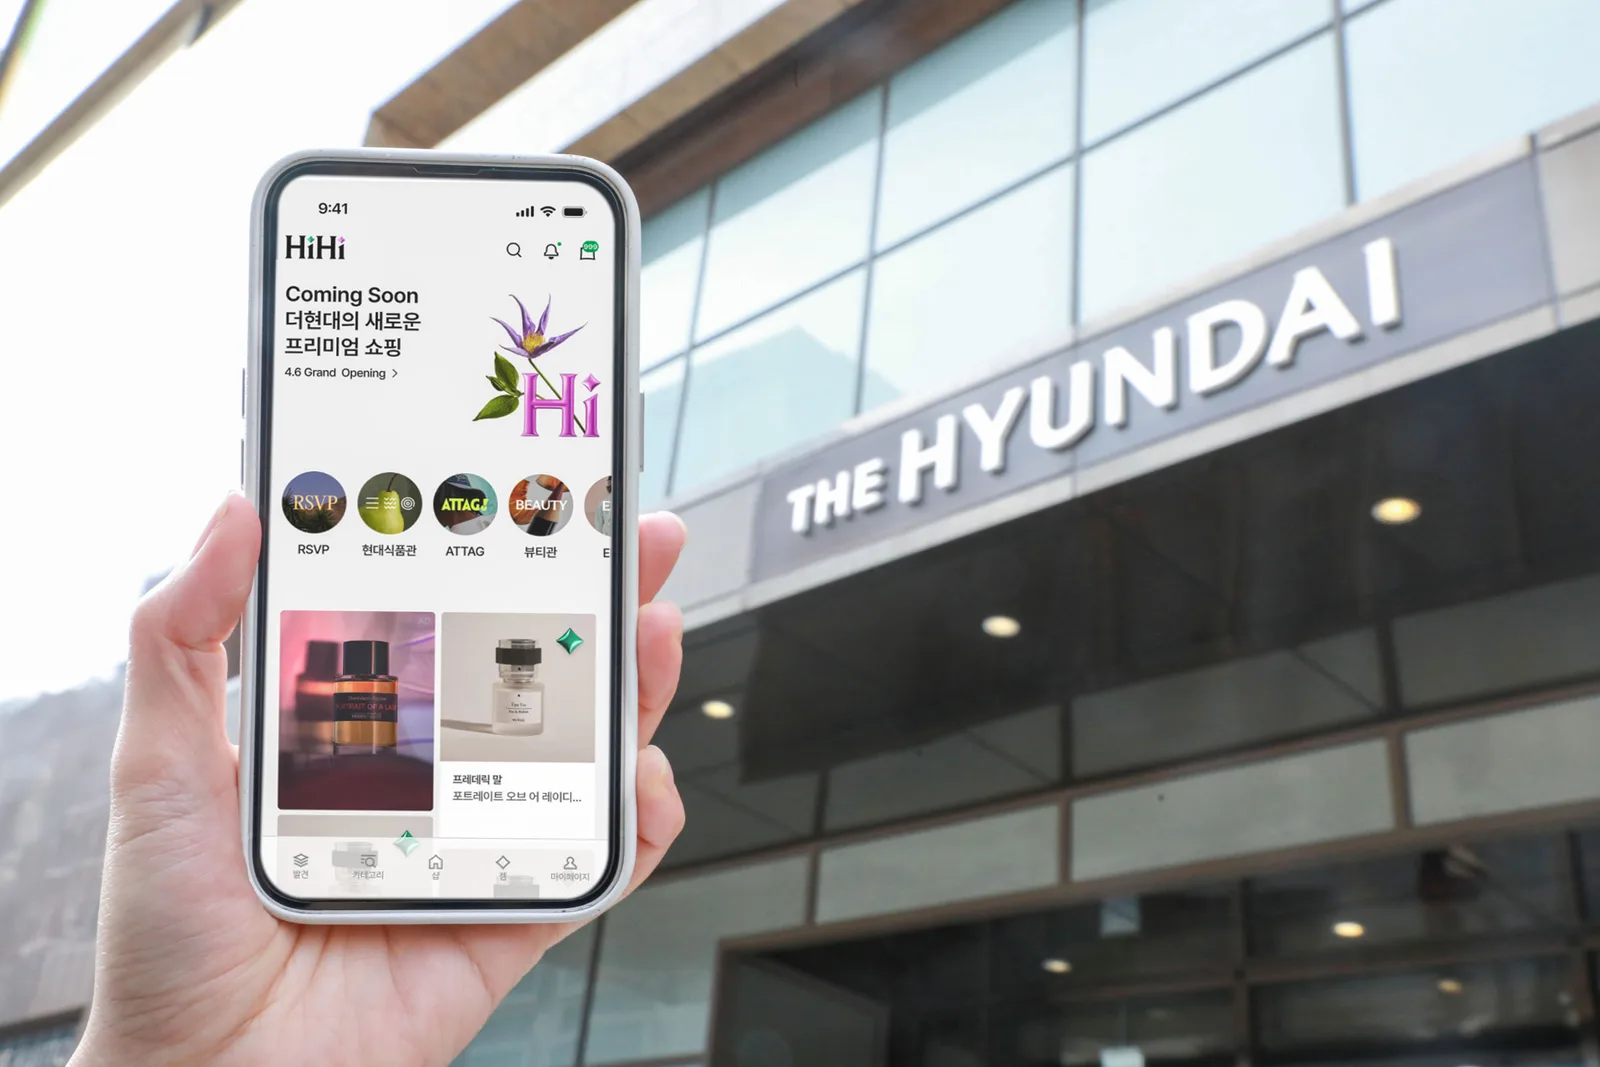
Hyundai Department Store: First-half foreign revenue reached roughly KRW 500.0 billion, already surpassing 70% of last year's full-year total (about KRW 700.0 billion). The Yeouido "The Hyundai Seoul" store alone drove the growth, with revenue up 134%.
The ministry's raw data on category revenue share also reveals that the department stores' revenue structure is already heavily concentrated.
Category
Accessories
Women's Formal
Women's Casual
Menswear
Kids/Sports
Home Goods
Overseas Luxury
Non-Food Subtotal
Food
Jan
8.3%
7.2%
6.2%
5.1%
9.8%
12.2%
38.0%
86.7%
13.3%
Feb
8.2%
5.9%
5.7%
3.5%
9.1%
12.9%
37.2%
82.5%
17.5%
Mar
8.9%
8.0%
6.8%
4.2%
10.1%
12.4%
37.8%
88.3%
11.7%
Apr
8.5%
6.5%
6.9%
4.1%
10.8%
10.7%
41.1%
88.5%
11.5%
May
9.7%
6.0%
7.2%
3.8%
10.4%
11.5%
40.0%
88.6%
11.4%
Jun
8.9%
6.2%
6.9%
3.6%
8.9%
15.3%
38.5%
88.3%
11.7%
Overseas luxury alone accounts for 37%–41% of revenue every month — meaning two out of every five dollars spent at a department store is effectively luxury spending. Food stays in the 11%–13% range, showing that among the three companies surveyed — Lotte, Hyundai, and Shinsegae — department stores have already fully transformed from "places to buy groceries" into "spaces for luxury and experiential consumption."
Per-store revenue and average purchase price trends confirm that this growth comes not from opening new stores, but from a genuine rise in the productivity of existing stores.
Category
Jul
Aug
Sep
Oct
Nov
Dec
Jan
Feb
Mar
Apr
May
Jun
Transaction count
-0.8%
-2.6%
-4.8%
+3.0%
+0.3%
+4.8%
+11.5%
+8.7%
+6.8%
+11.4%
+13.4%
+6.0%
Average purchase price
+6.0%
+5.6%
+10.1%
+9.0%
+12.0%
+4.3%
+1.7%
+15.6%
+7.4%
+9.3%
+9.8%
+15.2%
Per-store revenue
+12.6%
+6.5%
+8.6%
+16.2%
+16.3%
+13.2%
+17.4%
+30.1%
+18.8%
+26.1%
+26.8%
+24.4%
Store count has stayed essentially fixed at 56, yet per-store revenue has posted double-digit growth for twelve straight months. June's average purchase price came to KRW 135,621, up 15.2% from KRW 117,704 a year earlier — meaning the effect of spending more per transaction outweighs the effect of more people showing up (transaction count +6.0%). Layer this against the overseas-luxury concentration noted above, and the department stores' growth formula becomes clear: rather than opening more stores, get existing stores to sell more expensive things, more often, per transaction.
Combined first-half foreign revenue across the three companies reached KRW 1,720.0 billion — if this pace holds, annual foreign revenue could surpass KRW 3.0 trillion for the first time ever. All three companies have led not with discounting but with content as their weapon of choice: bringing K-pop and K-movie IP into their stores, expanding K-fashion concept shops where foreign shoppers account for as much as 70% of revenue, and using real-time translation services and massive digital media facades to keep foreign visitors moving through the store. As this publication noted in its duty-free first-half review, while duty-free struggles under the same foreign-inbound windfall, department stores have seized the win at precisely the opposite point — competing on "experience" rather than tariff exemption.
Inside Online Retail — Appliances Exploded While Fashion Collapsed
Online retail's (11 companies surveyed) first-half growth rate (+8.1%) is, as noted earlier, slower than last year's (+14.4%). But lay this slowdown out year by year, and it's clear this isn't a one-off blip.
Category
2023
2024
2025
2026
H1
+4.7%
+11.9%
+14.4%
+8.1%
H2
+6.9%
+13.5%
+9.4%
—
Annual
+5.8%
+12.7%
+11.8%
—
Online growth, which accelerated through 2024, dropped into single digits starting in the second half of 2025 (+9.4%) and has stayed there through the first half of 2026 (+8.1%). With online already accounting for 60% of all retail, it's entered a phase where returning to the double-digit growth rates of years past is hard to expect.
Still, this "8.1%" average also splits into an entirely different picture once broken down by category.
Category
Appliances
Books/Stationery
Fashion
Sports
Cosmetics
Kids/Baby
Food
Home/Furniture
Services/Other
Total
Jan
+10.5%
+9.6%
+10.1%
+8.8%
+15.5%
+8.9%
+7.7%
+9.6%
+2.1%
+8.2%
Feb
-4.6%
-9.6%
-3.7%
-5.6%
+7.4%
+4.6%
+17.4%
-0.9%
-0.1%
+3.9%
Mar
+11.1%
+4.1%
+2.0%
+2.1%
+15.8%
+10.7%
+10.6%
+9.5%
0.0%
+8.1%
Apr
+7.3%
+0.6%
+2.9%
+4.9%
+15.4%
+8.2%
+9.7%
+8.1%
+3.4%
+7.5%
May
+11.0%
-0.6%
+3.6%
+4.4%
+9.3%
+9.4%
+10.1%
+7.2%
+10.0%
+8.8%
Jun
+34.7%
+9.0%
-3.5%
+2.6%
+8.5%
+9.7%
+11.2%
+5.7%
+6.5%
+11.7%
June's online appliances revenue jumped 34.7% year-over-year — nearly triple May's +11.0%. Yet online fashion contracted -3.5% in the same month — reversing direction in a single month from +3.6% positive growth in May. The overall online growth rate of +11.7% is simply the average of these two extremes offsetting each other; each category is actually in an entirely different phase.
The reasoning behind the appliance surge isn't hard to guess. This release cited "an early heat wave" as one driver of convenience-store recovery, and in the same period, offline department stores' home goods (+35.6%) and offline appliance/culture categories overall (+31.1% in June) also spiked in tandem. Appliance-related categories surging simultaneously across online, offline, and department-store channels in a single month is very likely a case of seasonal cooling-appliance demand landing across multiple channels at once. The online fashion decline, on the other hand, is harder to pin down from this release alone — it could reflect demand migrating to vertical commerce players like Musinsa and Ably, or it could reflect the sample characteristics of the 11 companies surveyed (Gmarket Global, 11Street, Interpark, Coupang, SSG, Lotte On, Naver, and others).
Category
Appliances
Books/Stationery
Fashion
Sports
Cosmetics
Kids/Baby
Food
Home/Furniture
Services/Other
Jan
16.7%
2.1%
6.1%
2.5%
5.7%
3.2%
31.6%
17.0%
15.1%
Jun
19.6%
1.7%
6.2%
3.1%
5.1%
3.2%
29.8%
17.8%
13.5%
Looking at revenue share, food remains the largest single category in online retail, at around 30% — the basis for the ministry's description of online as having "established itself as a grocery channel." This is exactly where it connects with the hypermarket and SSM decline. That said, this online retail sales survey isn't a separately certified Statistics Korea survey (an 11-company sample), which should be kept in mind when reading it.
Key Insight #1 — "Nine Consecutive Quarters" Isn't a Business Cycle, It's a Signal That an Entire Channel Is Migrating
Hypermarket decline isn't fresh news. But taken at face value, the phrase "nine consecutive quarters since Q2 2024" describes not a cyclical downturn that rises and falls with the economy, but a structural trend that has moved in one direction for over two years straight. Online food revenue rose 11.0% year-over-year as of June, while offline food revenue fell 0.5% over the same period. The very place where consumers buy groceries is migrating from hypermarket and SSM stores to online, and there's no clear turning point in sight for this shift.
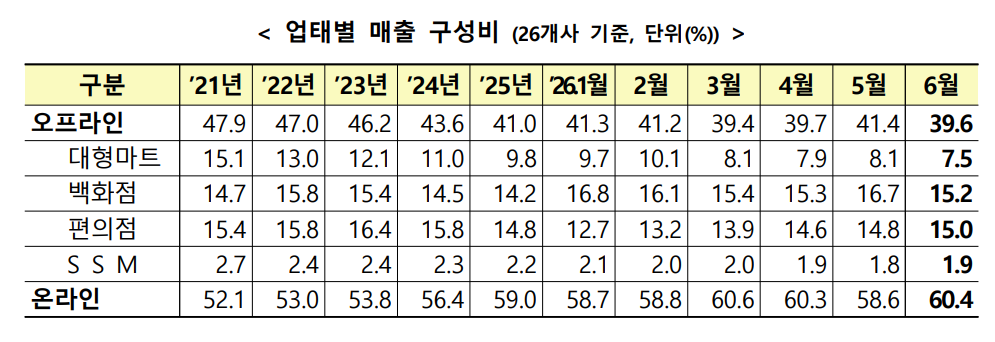
The five-year format revenue-share data the ministry released alongside this report makes the scale of this shift unmistakable.
Ministry of Trade, Industry and Energy chart of retail revenue share by format — within offline itself, only hypermarkets have selectively seen their share cut in half
Category
2021
2022
2023
2024
2025
Jun 2026
Offline
47.9%
47.0%
46.2%
43.6%
41.0%
39.6%
Hypermarkets
15.1%
13.0%
12.1%
11.0%
9.8%
7.5%
Department Stores
14.7%
15.8%
15.4%
14.5%
14.2%
15.2%
Convenience Stores
15.4%
15.8%
16.4%
15.8%
14.8%
15.0%
SSM
2.7%
2.4%
2.4%
2.3%
2.2%
1.9%
Online
52.1%
53.0%
53.8%
56.4%
59.0%
60.4%
Over five years, hypermarkets' revenue share fell exactly in half, from 15.1% to 7.5%. Department stores' share, meanwhile, actually edged up slightly, from 14.7% to 15.2%, and convenience stores held steady around 15%. In other words, the real story of this release isn't the simple narrative of "offline losing out to online." Within offline itself, only hypermarkets and SSM are selectively, and continuously, ceding ground. Department stores and convenience stores have held their own by leaning on strengths online can't easily replace — experience (department stores) and immediacy (convenience stores) — while hypermarkets' and SSM's core function, routine grocery purchases, has been the first and hardest hit by online's early-morning and same-day delivery.
Homeplus is the clearest evidence that this structural shift has reached a breaking point. In fiscal 2026, Homeplus posted revenue of KRW 5,796.3 billion (down more than KRW 1.0 trillion from KRW 6,992.0 billion the year before), an operating loss of KRW 546.4 billion, and a net loss of KRW 1.0 trillion. Current liabilities exceeded current assets by KRW 3,881.5 billion, and auditors declined to issue an opinion for the second year running. Store count fell from 123 to 67 in a single year, and 2,588 employees left between January and April alone. This is a case where the structural pressure facing the entire hypermarket industry hit the operator with the weakest financial capacity first, and in the most extreme form.
Key Insight #2 — Under the Same Downward Pressure, Survival Split Into Two Paths
What's interesting is that the hypermarket and SSM industry hasn't collapsed as a whole. Facing the same pressure of falling total revenue, operators have taken two distinct survival strategies.
First, giving up revenue to focus on profitability. E-Mart posted Q1 2026 operating profit of KRW 146.3 billion (+9.7%), its best first quarter in eight years, and Lotte Mart posted revenue of KRW 1,525.6 billion (+2.6%) and operating profit of KRW 33.8 billion (+20.2%). Both companies saw minimal company-wide revenue growth, or sat within the industry's overall decline, but improved margins by streamlining cost structures. The symbol of this trend is Lotte Mart's resumption of new store openings. After nearly six years without opening a new store since August 2019, Lotte Mart reopened its Cheonho store as a grocery-focused, no-frills format in January 2025, followed by reopening its Guri store as a "Grand Grocery" concept in June the same year. In place of the old era of indiscriminate expansion, this is selective reinvestment only in locations likely to survive. This echoes a pattern this publication covered previously in the simultaneous swing to profit at Korea's four duty-free operators — even when top-line growth stalls or shrinks, stripping out low-margin structure can still improve profitability.
Second, redefining the offline store's identity around quick commerce and instant delivery. GS The Fresh's quick-commerce revenue rose 32.8% year-over-year in Q1 2026, accounting for 10% of total revenue; the company has been shrinking face-to-face retail space and expanding meal-kit and ready-to-eat food since introducing a chain-store system in 2019. Homeplus Express, too, launched a one-hour same-day delivery service this March, after which July online delivery revenue jumped roughly 53% month-over-month. This is a shift in weight from "a place you go to buy groceries" to "a delivery hub."
Key Insight #3 — But Failing to Withstand This Pressure Means Getting Pushed Out of the Market Entirely
If E-Mart's and Lotte Mart's profitability defense, and GS The Fresh's and Homeplus Express's quick-commerce pivot, are cases that rebut the simplistic reading of "revenue decline equals crisis," Homeplus's collapse is evidence for the opposite. Homeplus Express suffered supply disruptions and inventory shortages amid its parent company's financial distress, losing demand to competitors, and was ultimately acquired by Harim Group affiliate NS Shopping on June 22. Harim didn't simply buy the stores — it's connecting group products across livestock, fresh food, HMR, and instant noodles to Homeplus Express shelves, entering the retail market directly as a manufacturing-based player. As a result, the SSM market has been reshaped into a "Big Four" structure of GS The Fresh, Lotte Super, E-Mart Everyday, and Harim (Homeplus Express).
In other words, even within the same format, the outcomes split three ways: those that streamlined cost structures to protect profitability (E-Mart, Lotte Mart), those that changed their identity to capture new demand (GS The Fresh), and those that could do neither and had to hand over their assets (Homeplus). The single-line statistic "nine consecutive quarters of decline" flattens all three of these outcomes into one.
Business Impact — A Reshuffling Over the Same Wallet
Department stores' hyper-growth and hypermarkets'/SSM's structural retreat aren't two events that happened to coincide — they're largely two faces of a reshuffling over the same consumer wallet. The 10.71 million foreign visitors and improved consumer sentiment flowed toward high-priced, non-routine spending (overseas luxury at department stores averaged +30.8% in the first half), lifting department-store revenue, while routine grocery-shopping demand drained into online, squeezing hypermarkets and SSM. The renewed talk within parts of the hypermarket industry of "easing mandatory closure regulations" is itself evidence of this pressure — behind that discussion lies the reality that the very channel these regulations have protected is losing out to consumer choice. Whether deregulation would actually produce a real rebound, or whether it's simply too weak to reverse a consumption shift that's already locked in, is a question worth weighing soberly. That said, online's 8.1% growth rate, though slower than last year's first half (+14.4%), should be read as a slowdown atop an already-larger base (a high-base effect) rather than a genuine weakening of momentum — online's share of the total keeps climbing, from 59.0% to 59.6%. The Ministry of Trade, Industry and Energy's "+7.3%" headline isn't a wrong number, but it bundles together department stores' record-high growth and hypermarkets'/SSM's longest-ever decline, along with winners who protected profitability and losers who had to sell off assets, all under the same downward pressure. The moment you read the entire retail industry through a single average, Homeplus's collapse and E-Mart's best quarter in eight years both disappear into the same sentence — "retail recovery." What's happening right now isn't recovery. It's reshuffling.
✦RIT's Insights
What stands out most in this release is the gap between the sense of crisis conveyed by the phrase "nine consecutive quarters of decline" and the fact that, within that same period, E-Mart posted its best quarterly results in eight years. This pattern — falling revenue alongside rising profit — is exactly the pattern this publication has repeatedly noted this month across the duty-free and cosmetics industries. How dangerous it is to judge an industry's health by total revenue alone has just been proven again, this time by the hypermarket sector.
That said, the Homeplus case draws a clear line under that optimistic reading. For the narrative that "revenue can shrink while fundamentals improve" to hold, a company needs at least some financial breathing room. When current liabilities exceed current assets by more than KRW 3.0 trillion and auditors have declined to issue an opinion for two straight years, as with Homeplus, structural decline isn't an opportunity to improve fundamentals — it's simply an exit signal. The reason the same statistic becomes an opportunity for one company and a death sentence for another ultimately comes down to whether that company has the time and capital to hold on. If RIT were in corporate planning for a hypermarket or SSM operator, now would not be the time to set revenue recovery as a KPI. The goal itself should be redesigned around protecting margins by trimming low-profit stores and items, as E-Mart and Lotte Mart have — but, following Lotte Mart's selective reopenings (Cheonho, Guri), the right approach is not blanket contraction, but reinvestment in locations likely to survive. For small nearby stores the picture is even clearer: as GS The Fresh and Homeplus Express show, competitiveness now comes from delivery speed rather than shelf assortment, so quick-commerce and same-day-delivery infrastructure investment should be prioritized ahead of offline store renovations. And because there's no way to reverse course once liquidity collapses, as with Homeplus, proactively reviewing cash flow and short-term debt maturity structures should be finance's top priority during any period of declining revenue.
In RIT's judgment, what's actually more concerning is the department-store side that's thriving. Holding store count flat at 56 while pushing per-store revenue up by double digits for twelve straight months, with a single category — overseas luxury — responsible for nearly half of it, isn't growth. It's concentration. And digging into this luxury surge, there isn't one cause but two. One is Chinese daigou resellers regaining purchasing power on the back of a strong yuan. The other is the "wealth effect" among Korea's domestic asset holders, fueled by a strong KOSPI and a semiconductor boom. Half of the growth that couldn't be explained by the foreign-tourist windfall alone turns out to be spending by wealthy Koreans whose portfolios did well.
The problem is that both of these pillars already show signs of wobbling. Industry reports indicate Lotte Department Store's luxury revenue growth rate fell from a first-half average in the 30% range to 15% in June, and that Shinsegae and Hyundai also saw growth peak in May before slowing. And on the very day this is being written (July 30) — just two days ago, on July 28 — the KOSPI plunged 10.84% in a single day, breaking sharply below the 6,000 mark. We just watched one of the two pillars propping up department-store growth, the "wealth effect," collapse in literal, real time. Just as hypermarkets leaned on a single category — food — and were fully exposed the moment consumer routines shifted, department stores too have staked half their growth on two external variables: daigou and the wealth effect. Anyone overseeing department stores or premium channels needs to start preparing scenarios now for when these two variables turn, so as not to belatedly repeat the sharp reversal hypermarkets already went through. One more thing worth adding — managing online retail by a single figure, "8.1% growth," is risky as well. E-commerce MD and category leads should keep in mind that both the opportunity in surging categories like appliances and the warning signs in declining categories like fashion are hidden behind that average, and should build category-specific inventory and marketing strategies accordingly. What happens the moment both of these pillars buckle at once will likely become clear as soon as next month's release.
#General Retail#General#Korea#General Retail#Ministry of Trade Industry and Energy#Department Stores#Hypermarkets#SSM#Online Retail#Homeplus#E-Mart#Lotte Mart#Retail Sales Trends