August Retail Sales Up 7.7%, Estimated at About KRW 16.9 Trillion — A Rebound Pulled Forward by an Early Chuseok
2026-09-27 9:54 AMGeneral
Overview
Major retailer sales for August, released September 23 by Korea's Ministry of Trade, Industry and Resource, rose 7.7% year-over-year to an estimated KRW 16.9 trillion. Online led the growth at about KRW 10.1 trillion (59.7% of the total), while hypermarkets returned to growth after five months and SSMs after eight. Department stores grew to an estimated KRW 2.32 trillion, but their growth rate has slowed for two straight months, from 22.2% in June to 11.9% in August.
Sales at major retailers in August 2026, released by Korea's Ministry of Trade, Industry and Resource (MOTIR) on September 23, rose 7.7% from a year earlier. Offline sales grew 5.4% and online sales grew 9.3%.
In this release, MOTIR published year-over-year growth rates and each format's share of sales, but — unlike in the past — did not publish absolute sales amounts.
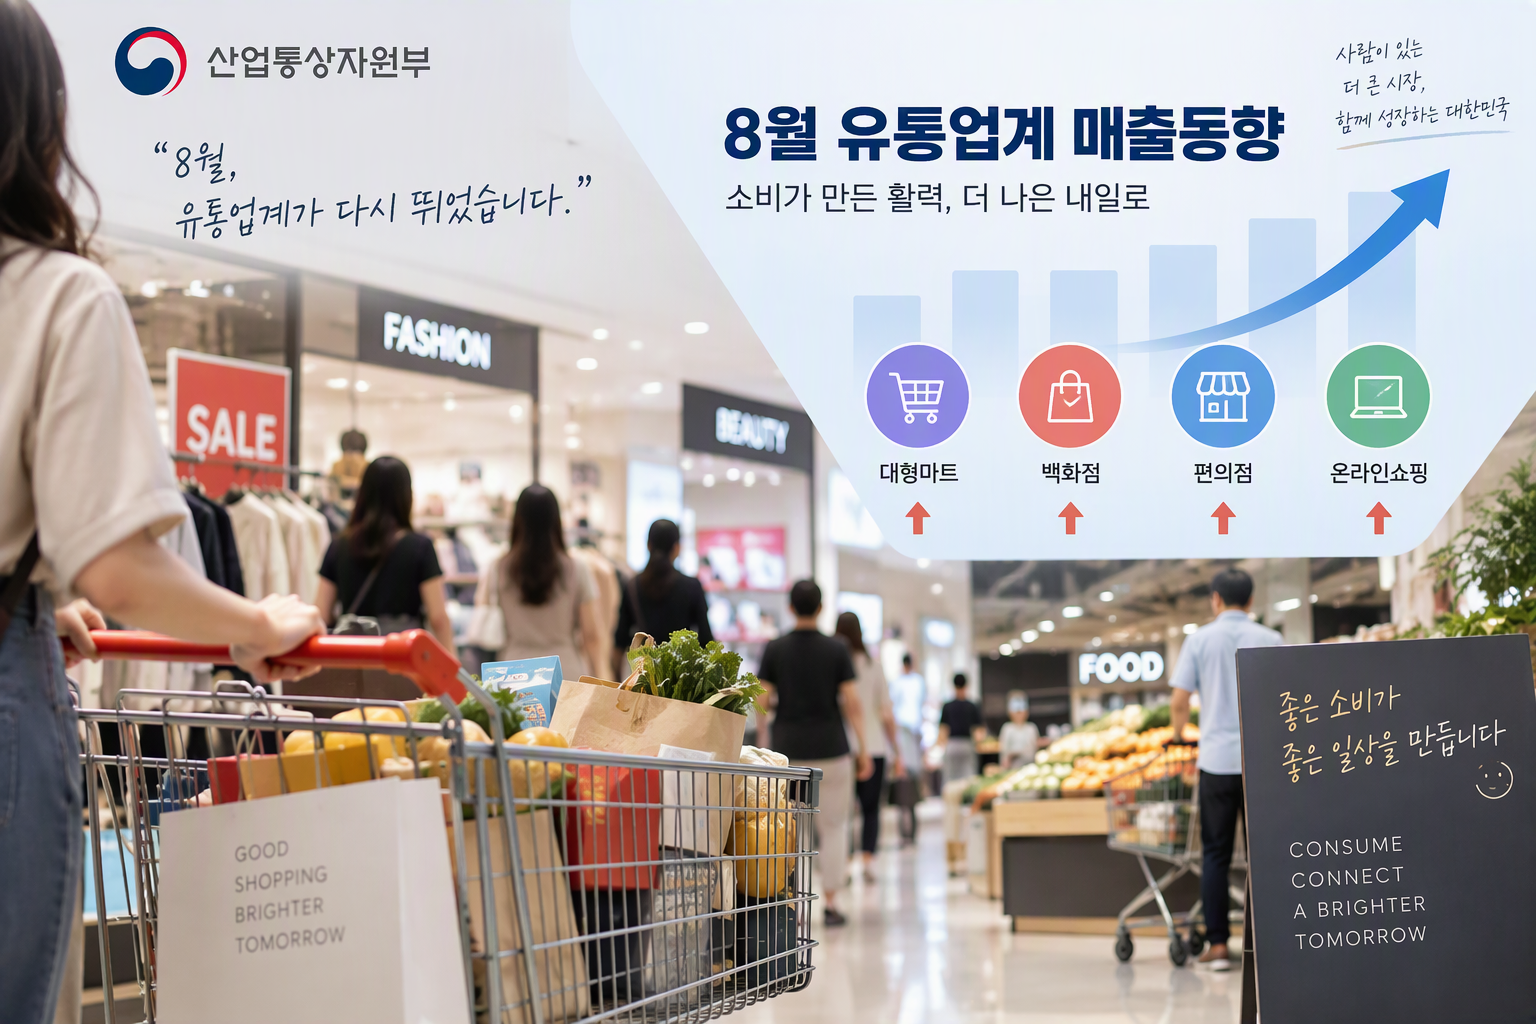
MOTIR's August retail sales trends, released September 23 — hypermarkets, department stores, convenience stores and online shopping all up year-over-year (Source: MOTIR)
Applying this year's 7.7% growth rate to the roughly KRW 15.7 trillion reported as total sales for August 2025 gives an estimate of about KRW 16.91 trillion for August 2026. This is not a sales figure officially published by MOTIR; it is an estimate converted from previously disclosed sales together with this year's published growth rates and composition ratios.
The formula is as follows.
Estimated August 2026 sales
 = August 2025 sales of about KRW 15.7 trillion × 1.077
 = about KRW 16.91 trillion
August Retail Sales Estimated at About KRW 16.9 Trillion
Of the estimated total of about KRW 16.91 trillion for August, online is estimated at about KRW 10.09 trillion and offline at about KRW 6.81 trillion.
Category
YoY change
August 2026 share
August 2026 estimated sales
Total
+7.7%
100.0%
About KRW 16.91 trillion
Online
+9.3%
59.7%
About KRW 10.09 trillion
Offline
+5.4%
40.3%
About KRW 6.81 trillion
Note: The sales amounts are not figures officially published by MOTIR. They are conversion estimates that apply the August 2026 growth rates and the shares by format and product category to the publicly reported total sales of about KRW 15.7 trillion for August 2025. Changes in the survey population and the rounding of the shares and the base sales figure can cause differences from actual sales.
Estimated online sales rose by about KRW 860 billion from the same month last year, and offline by about KRW 350 billion. Of the total increase of about KRW 1.21 trillion, a large share came from online.
Note that these increases are also estimates back-calculated from this year's shares and growth rates. They are neither official sales figures nor a sum of the actual financial statements of the same companies.
A Limitation of This Conversion — The Bases May Not Match
The biggest problem with this conversion is that the bases may not match. The base total of about KRW 15.7 trillion is the figure from the September 2025 release, in which online accounted for 53.2% of sales. This year's release puts the online share at 59.7%. That suggests the survey population or the basis of compilation may have changed. Splitting the base by the 2025 release's shares would put August 2025 online at about KRW 8.35 trillion and offline at about KRW 7.35 trillion, which is off by about KRW 0.9 trillion each from the back-calculated figures above (online KRW 9.24 trillion, offline KRW 6.46 trillion) — our own calculation. The back-calculated 2025 amounts therefore cannot be linked to the amounts reported at the time, and the online/offline split in particular is hard to rely on. The rounding of the base total to KRW 0.1 trillion adds further error.
The amounts in this article should therefore be read only as a way to gauge how much each channel and product category contributed to the increase — that is, its direction and rough proportion — not as precise sales figures, and they should not be cited as sales published by MOTIR.
By Format: Online at KRW 10.1 Trillion, Convenience Stores at KRW 2.60 Trillion, Department Stores at KRW 2.32 Trillion
Applying the August 2026 share by format to the estimated total, online is the largest at about KRW 10.09 trillion.
Among offline formats, convenience stores are estimated at about KRW 2.60 trillion, department stores at about KRW 2.32 trillion, hypermarkets at about KRW 1.52 trillion, and SSMs at about KRW 370 billion.
Format
YoY change
Share of sales
August 2025 back-calculated estimate
August 2026 estimate
Estimated change
Hypermarkets
+4.5%
9.0%
About KRW 1.46 trillion
About KRW 1.52 trillion
About +KRW 70 billion
Department stores
+11.9%
13.7%
About KRW 2.07 trillion
About KRW 2.32 trillion
About +KRW 250 billion
Convenience stores
+0.8%
15.4%
About KRW 2.58 trillion
About KRW 2.60 trillion
About +KRW 20 billion
SSM
+5.0%
2.2%
About KRW 350 billion
About KRW 370 billion
About +KRW 20 billion
Online
+9.3%
59.7%
About KRW 9.24 trillion
About KRW 10.09 trillion
About +KRW 860 billion
Note: The sales amounts are not figures officially published by MOTIR. They are conversion estimates that apply the August 2026 growth rates and the shares by format and product category to the publicly reported total sales of about KRW 15.7 trillion for August 2025. Changes in the survey population and the rounding of the shares and the base sales figure can cause differences from actual sales, and totals and line items may not match because of rounding.
Looking at absolute sales figures makes it clearer that online was the channel that drove overall growth in August.
The return to growth at hypermarkets and SSMs helped lift the overall growth rate above July's, but in estimated increase, online's roughly KRW 860 billion is far larger than hypermarkets' roughly KRW 70 billion and SSMs' roughly KRW 20 billion.
It is therefore more accurate to read these figures as online leading overall growth, with the rebound at hypermarkets and SSMs improving the offline growth rate.
Hypermarket and SSM Rebound: Look at the Early Chuseok Effect
Hypermarkets grew 4.5% year-over-year, turning positive for the first time in five months. SSMs also grew 5.0%, breaking out of decline after eight months.
Category
July growth
August growth
Change
Total
+6.4%
+7.7%
+1.3pp
Offline
+3.2%
+5.4%
+2.2pp
Online
+8.5%
+9.3%
+0.8pp
Hypermarkets
-11.2%
+4.5%
+15.7pp
Department stores
+17.9%
+11.9%
-6.0pp
Convenience stores
+1.1%
+0.8%
-0.3pp
SSM
-2.9%
+5.0%
+7.9pp
Hypermarkets improved by 15.7 percentage points, from -11.2% in July to +4.5% in August, and SSMs turned positive, from -2.9% to +5.0%.
However, this year's earlier Chuseok schedule contributed to the rebound.
The 2026 Chuseok holiday runs from September 24 to 27, earlier than October 3–9 in 2025. As a result, pre-sales of Chuseok gift sets started earlier, and part of that revenue was booked in August.
Food sales at hypermarkets rose 5.4%, and appliances and toys rose 17.8%. At SSMs, sales of agricultural and livestock products rose 10.1%. Department store food sales also rose 14.5%.
Whether the rebound at hypermarkets and SSMs reflects a structural improvement in consumer capacity or a temporary effect of holiday demand being pulled forward will have to be checked against results after Chuseok.
By Product Category: Food at About KRW 6.61 Trillion, Services/Other at About KRW 2.62 Trillion
Applying the product-category shares published by MOTIR to the estimated total sales, food is the largest, at about KRW 6.61 trillion.
Category
YoY change
Share of sales
August 2026 estimated sales
Estimated change
Food
+8.1%
39.1%
About KRW 6.61 trillion
About +KRW 500 billion
Services/other
+11.3%
15.5%
About KRW 2.62 trillion
About +KRW 270 billion
Home/household
+3.2%
14.0%
About KRW 2.37 trillion
About +KRW 70 billion
Appliances/culture
+9.4%
11.3%
About KRW 1.91 trillion
About +KRW 160 billion
Fashion/accessories
+3.7%
10.1%
About KRW 1.71 trillion
About +KRW 60 billion
Kids/sports
+3.9%
5.0%
About KRW 850 billion
About +KRW 30 billion
Overseas luxury brands
+15.6%
5.0%
About KRW 850 billion
About +KRW 110 billion
Note: The sales amounts are not figures officially published by MOTIR. They are conversion estimates that apply the August 2026 growth rates and the shares by format and product category to the publicly reported total sales of about KRW 15.7 trillion for August 2025. The category amounts apply the published category shares to the converted total of about KRW 16.91 trillion and may differ from the sum of individual companies' actual sales by category. Changes in the survey population and the rounding of the shares and the base sales figure can cause differences from actual sales.
By amount, food is estimated to have contributed most to the overall increase, up about KRW 500 billion.
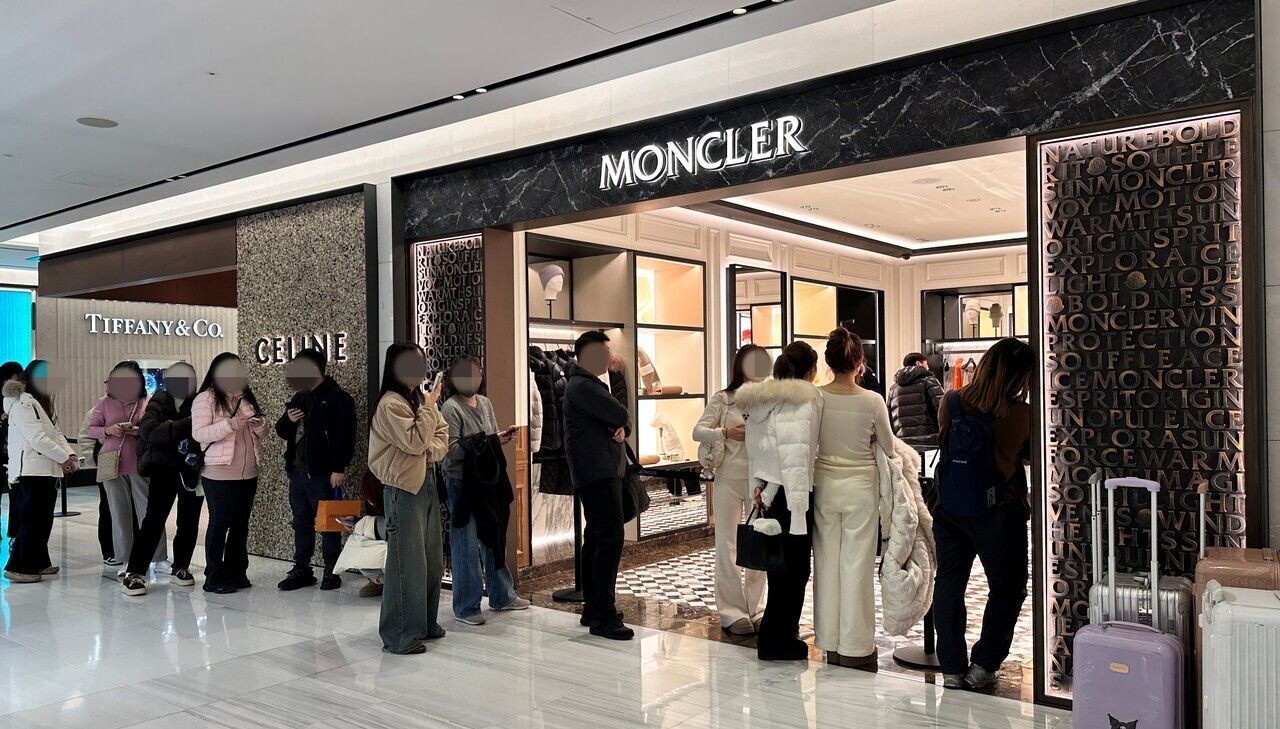
Services/other, helped by growth in food delivery, travel and culture products, and e-coupons, is calculated to have risen by about KRW 270 billion. Overseas luxury brands grew the fastest, at 15.6%, but with only a 5.0% share of the total, their estimated increase is about KRW 110 billion.
This shows that growth rates alone should not be used to judge contribution to the market. Overseas luxury brands have the highest growth rate, but the actual increase in amount is larger in food and services/other, which are much larger categories.
Hypermarket Sales Estimated at KRW 1.52 Trillion — A Rebound After Five Months, but From a Low Base
August hypermarket sales are estimated at about KRW 1.52 trillion, an increase of about KRW 70 billion from the back-calculated estimate of about KRW 1.46 trillion for the same month last year.
However, hypermarket sales in August 2025 had fallen 15.1% from a year earlier. With this year's 4.5% growth coming off a lowered baseline, the return to growth alone is hard to call a full recovery.
Chaining the year-over-year growth rates for 2025 and 2026, hypermarket sales in August 2026 work out to about 11.3% below the level of August 2024.
(1 - 0.151) × (1 + 0.045) - 1
 = about -11.3%
Category
August 2025
August 2026
Two-year chained change
Total
+3.6%
+7.7%
+11.6%
Offline
-3.3%
+5.4%
+1.9%
Online
+9.2%
+9.3%
+19.4%
Department stores
+2.8%
+11.9%
+15.0%
Hypermarkets
-15.1%
+4.5%
-11.3%
SSM
-5.9%
+5.0%
-1.2%
Convenience stores
+0.7%
+0.8%
+1.5%
This is not an index chaining the actual sales of the same companies; it is a reference value that mathematically chains each year's year-over-year growth rate. Because the survey population and sample may have changed, it should not be used as an exact long-term sales comparison. The August 2025 growth rates use the values recorded in e-National Indicators, which differ slightly from those announced at the time (total +3.7%, offline -3.1%, online +10.5%); using the announced figures, online's two-year chained value would be +20.8%. The figures by format should also be checked against the announcement at the time.
Department Stores at About KRW 2.32 Trillion — Absolute Sales Up, but Growth Is Slowing
August department store sales are estimated at about KRW 2.32 trillion, an increase of about KRW 250 billion from the back-calculated estimate of about KRW 2.07 trillion for the same month last year.
At 11.9%, growth is still high on its own. But the monthly trend shows department store growth easing for two straight months, from 22.2% in June to 17.9% in July and 11.9% in August.
Month
Department stores, YoY
June
+22.2%
July
+17.9%
August
+11.9%
August results already include the Chuseok gift-set effect of a 14.5% rise in food sales. That growth slowed even with the holiday boost suggests that growth in the non-food segments of department stores may have lost momentum.
Still, estimated absolute sales remain higher than a year ago. Department store conditions should therefore not be described as a "sales decline." The accurate description is that sales rose but the pace of increase slowed.
And because actual department store sales by category and the share of foreign customers are not published, it is also hard to conclude that high-priced goods or foreign demand led the slowdown.
Convenience Stores at About KRW 2.60 Trillion — A Large Format, but an Increase of Only About KRW 20 Billion
August convenience store sales are estimated at about KRW 2.60 trillion. It is the largest offline format, but year-over-year growth was only 0.8%.
Since the back-calculated estimate for the same month last year is about KRW 2.58 trillion, the increase is only about KRW 20 billion.
MOTIR explained that the heat wave reduced outdoor activity and the number of visitors fell, but higher spend per purchase led to a slight increase in overall sales.
Convenience stores are larger than department stores and hypermarkets in sales, but their growth rate and increase in amount are relatively low. If the decline in visitors continues and the rise in spend per purchase also fades, overall sales could turn to decline.
Read September and October Together
The 2026 Chuseok holiday falls in September, whereas the 2025 Chuseok holiday fell in October.
This year's September growth rate could therefore rise as main holiday demand is booked. October, on the other hand, is compared against a base that included last year's Chuseok sales, so it could show a sharp decline.
Even if October growth at hypermarkets or department stores plunges, it should not be assumed that consumption suddenly contracted. Conversely, even if September growth is much higher, it is hard to interpret that as an acceleration of the consumption recovery.
To reduce the effect of the shift in holiday timing, sales for the three months from August to October should be compared with the same period a year earlier. Whether the recovery at hypermarkets and SSMs is structural needs to be checked through results for November, when the holiday effect is gone.
Rising Sales at Major Retailers Do Not Mean Consumption as a Whole Has Recovered
The survey covers 26 major retailers, 15 offline and 11 online.
It is also based on nominal sales, not sales volume. Sales can rise from price increases or a larger share of high-priced goods alone.
So the rise in estimated sales at major retailers from KRW 15.7 trillion to about KRW 16.91 trillion does not mean that domestic consumption as a whole recovered by the same margin.
That is because the survey is limited to large retailers, and its sample, price basis and scope differ from Statistics Korea's retail sales index.
✦RIT's Insights
More than the 7.7% headline, what matters in this release is that when the increase is broken into amounts, online accounts for most of it. The return to growth at hypermarkets and SSMs stands out, but their increase is less than a tenth of online's, and the rebound leans on gift-set demand pulled forward by an early Chuseok. Department stores grew sales even so, but with the holiday effect added, their growth rate fell from 22.2% in June to 11.9%, which should be read as a slowing pace of growth, not a sales decline. Until October and November figures show whether the gains hold once the holiday effect drops out, August's rebound is hard to treat as a confirmed signal of consumption recovery.
The two-year chained values and the absolute amounts (KRW trillion / billion) are conversion and back-calculation estimates computed from published growth rates and shares, not figures published by any company or agency, and may differ because of rounding and changes in the survey sample.
#General Retail#General#Korea#General Retail#Ministry of Trade Industry and Resource#Retail Sales Trends#Department Stores#Hypermarkets#SSM#Convenience Stores#Online Retail#Chuseok